CentOS 7 环境下基于 Prometheus 与 Grafana 的 MySQL 及 Redis 监控实战
环境规划与系统初始化
在构建可观测性体系时,数据库与缓存的性能指标是核心关注点。本文将详细演示如何在 CentOS 7 系统中部署 MySQL 和 Redis 服务,并通过对应的 Exporter 将指标接入 Prometheus,最终在 Grafana 中实现可视化监控。
节点规划
- 监控服务端 (Prometheus & Grafana): 10.0.0.10
- 目标采集端 (MySQL & Redis): 10.0.0.20
系统安全与网络配置
在目标采集端(10.0.0.20)执行以下操作,放行必要的服务与 Exporter 端口,并调整 SELinux 策略以避免权限拦截。
# 批量开放 MySQL、Redis 及其 Exporter 端口
firewall-cmd --permanent --add-port={3306,6379,9104,9121}/tcp
firewall-cmd --reload

# 临时关闭 SELinux 并修改配置文件使其永久生效
setenforce 0
sed -i 's/^SELINUX=enforcing/SELINUX=disabled/' /etc/selinux/config
MySQL 服务部署与 mysqld_exporter 集成
安装与初始化 MySQL
在目标采集端通过官方 Yum 源安装 MySQL 5.7 社区版。
# 下载并安装 MySQL 官方 Yum 仓库配置包
wget https://repo.mysql.com/mysql57-community-release-el7-11.noarch.rpm
rpm -ivh mysql57-community-release-el7-11.noarch.rpm

# 安装 MySQL 服务端(跳过 GPG 校验以加速安装)
yum install -y mysql-community-server --nogpgcheck

# 启动服务并设置开机自启
systemctl enable --now mysqld
获取初始临时密码并重置 root 账户凭证:
# 提取临时密码
TEMP_PWD=$(grep 'temporary password' /var/log/mysqld.log | awk '{print $NF}')

# 登录并修改 root 密码,同时降低密码复杂度策略(仅限测试环境)
mysql -uroot -p"$TEMP_PWD" --connect-expired-password -e "
SET GLOBAL validate_password_policy=LOW;
SET GLOBAL validate_password_length=6;
ALTER USER 'root'@'localhost' IDENTIFIED BY 'Admin@2023!';
"
部署 mysqld_exporter
为了让 Prometheus 能够安全地采集 MySQL 指标,需要创建一个权限最小化的专用数据库用户,并配置 Exporter。
-- 在 MySQL 中执行,创建监控专用账户并授予必要权限
CREATE USER 'metrics_agent'@'localhost' IDENTIFIED BY 'Agent@Pass123' WITH MAX_USER_CONNECTIONS 5;
GRANT PROCESS, REPLICATION CLIENT, SELECT ON *.* TO 'metrics_agent'@'localhost';
FLUSH PRIVILEGES;
下载并解压 Exporter 二进制文件:
EXPORTER_VER="0.15.1"
curl -sLO "https://github.com/prometheus/mysqld_exporter/releases/download/v${EXPORTER_VER}/mysqld_exporter-${EXPORTER_VER}.linux-amd64.tar.gz"
tar -xzf "mysqld_exporter-${EXPORTER_VER}.linux-amd64.tar.gz" -C /opt/
ln -s "/opt/mysqld_exporter-${EXPORTER_VER}.linux-amd64" /opt/mysqld_exporter
创建数据库连接凭证文件 /opt/mysqld_exporter/config.my.cnf:
[client]
user=metrics_agent
password=Agent@Pass123
host=127.0.0.1
port=3306
配置 Systemd 服务以实现进程守护,创建 /etc/systemd/system/mysqld_exporter.service:
[Unit]
Description=Prometheus MySQL Exporter
After=network.target

[Service]
Type=simple
ExecStart=/opt/mysqld_exporter/mysqld_exporter --config.my-cnf=/opt/mysqld_exporter/config.my.cnf --web.listen-address=:9104
Restart=on-failure

[Install]
WantedBy=multi-user.target
# 重载配置并启动服务
systemctl daemon-reload
systemctl enable --now mysqld_exporter
Redis 服务部署与 redis_exporter 集成
安装与配置 Redis
为简化编译依赖,此处采用 EPEL 仓库直接安装 Redis,并通过 sed 快速调整核心配置。
# 安装 EPEL 源及 Redis
yum install -y epel-release
yum install -y redis

# 修改绑定地址为所有网卡,并开启后台守护进程模式
sed -i 's/^bind 127.0.0.1/bind 0.0.0.0/' /etc/redis.conf
sed -i 's/^daemonize no/daemonize yes/' /etc/redis.conf

# 启动 Redis 服务
systemctl enable --now redis
部署 redis_exporter
下载 Redis Exporter 并配置 Systemd 服务,通过环境变量传递连接参数,避免在启动命令中硬编码敏感信息。
REDIS_EXP_VER="1.52.0"
curl -sLO "https://github.com/oliver006/redis_exporter/releases/download/v${REDIS_EXP_VER}/redis_exporter-v${REDIS_EXP_VER}.linux-amd64.tar.gz"
tar -xzf "redis_exporter-v${REDIS_EXP_VER}.linux-amd64.tar.gz" -C /opt/
ln -s "/opt/redis_exporter-v${REDIS_EXP_VER}.linux-amd64" /opt/redis_exporter
创建 /etc/systemd/system/redis_exporter.service:
[Unit]
Description=Prometheus Redis Exporter
After=network.target

[Service]
Type=simple
Environment=REDIS_ADDR=redis://127.0.0.1:6379
ExecStart=/opt/redis_exporter/redis_exporter --web.listen-address=:9121
Restart=on-failure

[Install]
WantedBy=multi-user.target
systemctl daemon-reload
systemctl enable --now redis_exporter
Prometheus 采集配置与 Grafana 可视化
更新 Prometheus 采集任务
在监控服务端(10.0.0.10),编辑 prometheus.yml 文件,将目标节点的 Exporter 端点纳入采集范围。通过 labels 为不同中间件打上业务标签,便于后续 PromQL 聚合查询。
scrape_configs:
  - job_name: 'middleware_metrics'
    static_configs:
      - targets: ['10.0.0.20:9104']
        labels:
          service: 'mysql'
          env: 'production'
      - targets: ['10.0.0.20:9121']
        labels:
          service: 'redis'
          env: 'production'
# 重启 Prometheus 使配置生效
systemctl restart prometheus
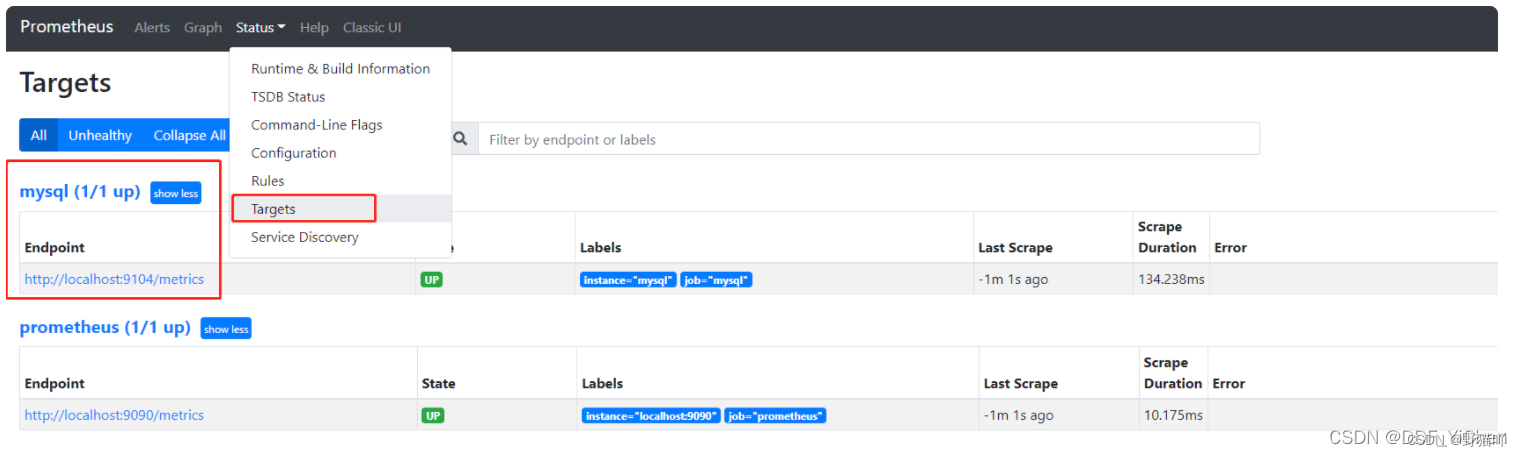
登录 Prometheus Web UI (http://10.0.0.10:9090),在 Status -> Targets 菜单下确认端点状态为 UP。
Grafana 监控大盘导入
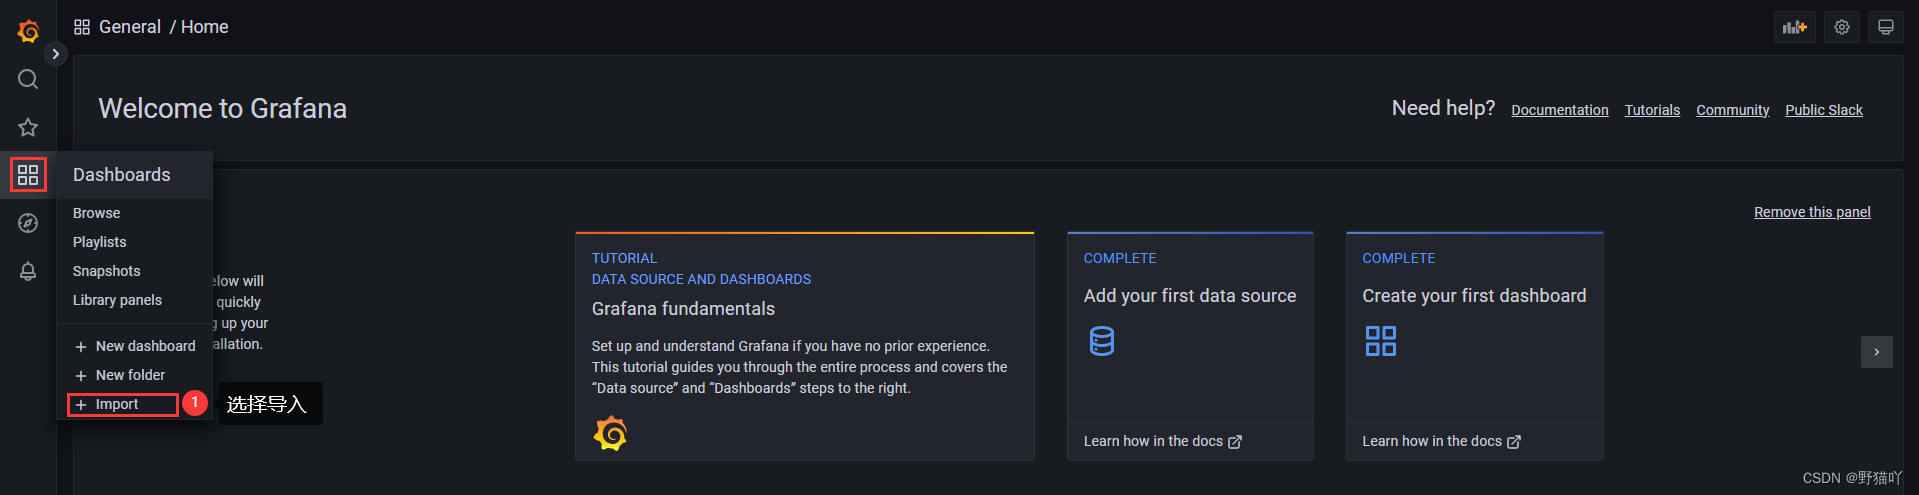
在 Grafana 中配置好 Prometheus 数据源后,通过 Import Dashboard 功能导入社区优质面板。推荐使用以下 Dashboard ID:
- MySQL 监控: 7362 (Percona MySQL Overview)
- Redis 监控: 763 (Redis Dashboard for Prometheus)
导入后,选择对应的数据源与实例标签,即可实时查看 QPS、内存碎片率、连接数及慢查询等核心指标。